
Page 61 - Proxy Statement - 2020
P. 61
Executive Compensation
Executive Officer Compensation
The following tables show annual and long-term compensation, for services in all capacities to Martin Marietta, earned by the Chief
Executive Officer, the Chief Financial Officer, and the three other most highly compensated executive officers in 2019, which we refer
to collectively in this section of this proxy statement as the “named executive officers” or “NEOs.” These tables and the accompanying
narratives should be read in conjunction with the Compensation Discussion and Analysis section of this proxy statement, which provides
a detailed overview of the methods used by Martin Marietta to compensate its officers, including the named executive officers.
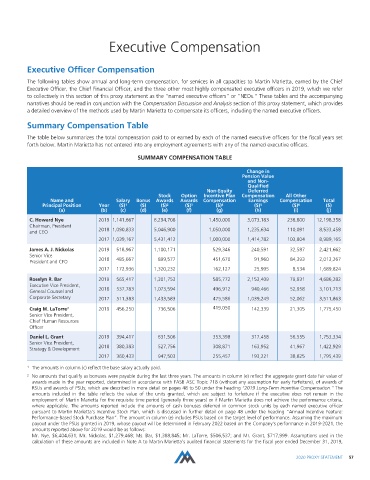
Summary Compensation Table
The table below summarizes the total compensation paid to or earned by each of the named executive officers for the fiscal years set
forth below. Martin Marietta has not entered into any employment agreements with any of the named executive officers.
SUMMARY COMPENSATION TABLE
Change in
Pension Value
and Non-
Qualified
Non-Equity Deferred
Stock Option Incentive Plan Compensation All Other
Name and Salary Bonus Awards Awards Compensation Earnings Compensation Total
Principal Position Year ($) 1 ($) ($) 2 ($) 3 ($) 4 ($) 5 ($) 6 ($)
(a) (b) (c) (d) (e) (f) (g) (h) (i) (j)
C. Howard Nye 2019 1,141,667 6,294,708 1,450,000 3,073,183 238,800 12,198,358
Chairman, President
and CEO 2018 1,090,833 5,046,900 1,050,000 1,235,634 110,091 8,533,458
2017 1,039,167 5,431,412 1,000,000 1,414,782 103,804 8,989,165
James A. J. Nickolas 2019 518,967 1,100,171 529,346 240,591 32,587 2,421,662
Senior Vice
President and CFO 2018 485,667 899,577 451,670 91,960 84,393 2,013,267
2017 172,936 1,320,232 162,127 25,995 8,534 1,689,824
Roselyn R. Bar 2019 565,417 1,301,753 585,772 2,153,409 79,931 4,686,282
Executive Vice President,
General Counsel and 2018 537,783 1,073,594 496,912 940,466 52,958 3,101,713
Corporate Secretary 2017 511,383 1,433,583 475,586 1,039,249 52,062 3,511,863
Craig M. LaTorre 7 2019 456,250 736,506 419,050 142,339 21,305 1,775,450
Senior Vice President,
Chief Human Resources
Officer
Daniel L. Grant 2019 394,417 631,506 353,398 317,458 56,555 1,753,334
Senior Vice President,
Strategy & Development 2018 380,383 527,756 308,871 163,952 41,967 1,422,929
2017 360,433 947,503 255,457 193,221 38,825 1,795,439
1 The amounts in column (c) reflect the base salary actually paid.
2 No amounts that qualify as bonuses were payable during the last three years. The amounts in column (e) reflect the aggregate grant date fair value of
awards made in the year reported, determined in accordance with FASB ASC Topic 718 (without any assumption for early forfeiture), of awards of
RSUs and awards of PSUs, which are described in more detail on pages 48 to 50 under the heading “2019 Long-Term Incentive Compensation.” The
amounts included in the table reflects the value of the units granted, which are subject to forfeiture if the executive does not remain in the
employment of Martin Marietta for the requisite time period (generally three years) or if Martin Marietta does not achieve the performance criteria,
where applicable. The amounts reported include the amounts of cash bonuses deferred in common stock units by each named executive officer
pursuant to Martin Marietta’s Incentive Stock Plan, which is discussed in further detail on page 48 under the heading “Annual Incentive Feature:
Performance-Based Stock Purchase Plan”. The amount in column (e) includes PSUs based on the target level of performance. Assuming the maximum
payout under the PSUs granted in 2019, whose payout will be determined in February 2022 based on the Company’s performance in 2019-2021, the
amounts reported above for 2019 would be as follows:
Mr. Nye, $6,404,631; Mr. Nickolas, $1,279,468; Ms. Bar, $1,388,845; Mr. LaTorre, $506,537; and Mr. Grant, $717,999. Assumptions used in the
calculation of these amounts are included in Note A to Martin Marietta’s audited financial statements for the fiscal year ended December 31, 2019,
2020 PROXY STATEMENT 57