
Page 55 - 2023 Sustainability Report
P. 55
ENVIRONMENTAL STEWARDSHIP
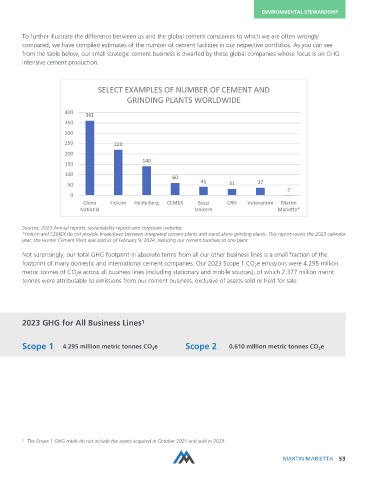
To further illustrate the difference between us and the global cement companies to which we are often wrongly
compared, we have compiled estimates of the number of cement facilities in our respective portfolios. As you can see
from the table below, our small strategic cement business is dwarfed by these global companies whose focus is on GHG
intensive cement production.
SELECT EXAMPLES OF NUMBER OF CEMENT AND
GRINDING PLANTS WORLDWIDE
400
361
350
300
250 220
200
140
150
100
60
41 37
50 31
2
0
China Holcim Heidelberg CEMEX Buzzi CRH Votorantim Mar n
National Unicem Marie a*
Sources: 2023 Annual reports; sustainability reports and corporate websites.
*Holcim and CEMEX do not provide breakdown between integrated cement plants and stand alone grinding plants. This report covers the 2023 calendar
year; the Hunter Cement Plant was sold as of February 9, 2024, reducing our cement business to one plant.
Not surprisingly, our total GHG footprint in absolute terms from all our other business lines is a small fraction of the
footprint of many domestic and international cement companies. Our 2023 Scope 1 CO e emissions were 4.295 million
2
metric tonnes of CO e across all business lines (including stationary and mobile sources), of which 2.377 million metric
2
tonnes were attributable to emissions from our cement business, exclusive of assets sold or held for sale.
2023 GHG for All Business Lines 1
Scope 1 4.295 million metric tonnes CO e Scope 2 0.610 million metric tonnes CO e
2
2
1 The Scope 1 GHG totals do not include the assets acquired in October 2021 and sold in 2023.
MARTIN MARIETTA 53