
Page 56 - 2023 Sustainability Report
P. 56
ENVIRONMENTAL STEWARDSHIP
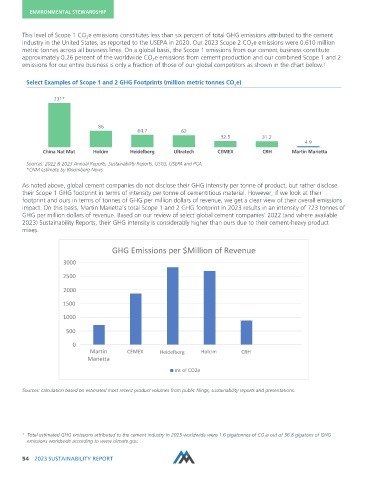
This level of Scope 1 CO e emissions constitutes less than six percent of total GHG emissions attributed to the cement
2
industry in the United States, as reported to the USEPA in 2020. Our 2023 Scope 2 CO e emissions were 0.610 million
2
metric tonnes across all business lines. On a global basis, the Scope 1 emissions from our cement business constitute
approximately 0.26 percent of the worldwide CO e emissions from cement production and our combined Scope 1 and 2
2
emissions for our entire business is only a fraction of those of our global competitors as shown in the chart below. 1
Select Examples of Scope 1 and 2 GHG Footprints (million metric tonnes CO e)
2
231*
86
64.7 62
32.5 31.2
4.9
China Nat Mat Holcim Heidelberg Ultratech CEMEX CRH Martin Marietta
Sources: 2022 & 2023 Annual Reports, Sustainability Reports, USGS, USEPA and PCA
*CNM estimate by Bloomberg News
As noted above, global cement companies do not disclose their GHG intensity per tonne of product, but rather disclose
their Scope 1 GHG footprint in terms of intensity per tonne of cementitious material. However, if we look at their
footprint and ours in terms of tonnes of GHG per million dollars of revenue, we get a clear view of their overall emissions
impact. On this basis, Martin Marietta’s total Scope 1 and 2 GHG footprint in 2023 results in an intensity of 723 tonnes of
GHG per million dollars of revenue. Based on our review of select global cement companies’ 2022 (and where available
2023) Sustainability Reports, their GHG intensity is considerably higher than ours due to their cement-heavy product
mixes.
GHG Emissions per $Million of Revenue
3000
2500
2000
1500
1000
500
0
Martin CEMEX Heidelberg Holcim CRH
Marietta
mt of CO2e
Sources: calculation based on estimated most recent product volumes from public filings, sustainability reports and presentations.
1 Total estimated GHG emissions attributed to the cement industry in 2023 worldwide were 1.6 gigatonnes of CO 2 e out of 36.8 gigatons of GHG
emissions worldwide according to www.climate.gov.
54 2023 SUSTAINABILITY REPORT