
Page 92 - 2019 Annual Report
P. 92
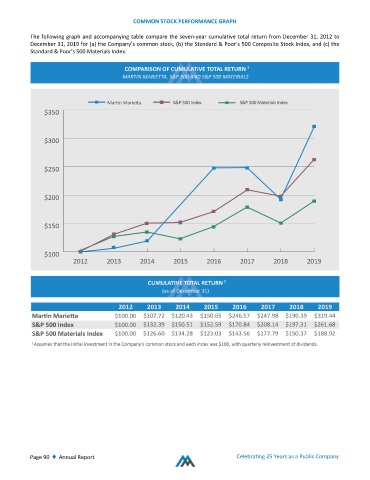
COMMON STOCK PERFORMANCE GRAPH

           The following graph and accompanying table compare the seven‐year cumulative total return from December 31, 2012 to
           December 31, 2019 for (a) the Company’s common stock, (b) the Standard & Poor’s 500 Composite Stock Index, and (c) the
           Standard & Poor’s 500 Materials Index.


           Page 90  ♦  Annual Report                                           Celebrating 25 Years as a Public Company