
Page 91 - 2019 Annual Report
P. 91
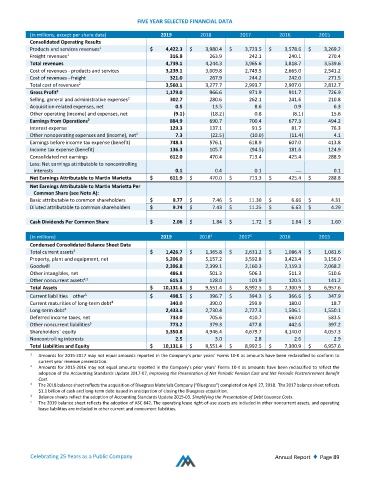
FIVE YEAR SELECTED FINANCIAL DATA

           (in millions, except per share data)       2019          2018         2017         2016         2015
           Consolidated Operating Results
           Products and services revenues           $   4,422.3     $   3,980.4     $   3,723.5     $   3,578.6     $   3,269.2
                                  1
           Freight revenues                              316.8         263.9         242.1         240.1         270.4
                       1
           Total revenues                               4,739.1         4,244.3         3,965.6         3,818.7         3,539.6
           Cost of revenues ‐ products and services          3,239.1         3,009.8         2,749.5         2,665.0         2,541.2
           Cost of revenues ‐ freight                    321.0         267.9         244.2         242.0         271.5
           Total cost of revenues                       3,560.1         3,277.7         2,993.7         2,907.0         2,812.7
                           2
           Gross Profit                                 1,179.0         966.6         971.9         911.7         726.9
                    2
           Selling, general and administrative expenses           302.7         280.6         262.1         241.6         210.8
                                           2
           Acquisition‐related expenses, net               0.5         13.5          8.6          0.9          6.3
           Other operating (income) and expenses, net          (9.1 )       (18.2 )       0.8         (8.1 )       15.6
           Earnings from Operations                      884.9         690.7         700.4         677.3         494.2
                              2
           Interest expense                              129.3         137.1         91.5         81.7         76.3
           Other nonoperating expenses and (income), net           7.3         (22.5 )       (10.0 )       (11.4 )       4.1
                                              2
           Earnings before income tax expense (benefit)          748.3         576.1         618.9         607.0         413.8
           Income tax expense (benefit)                  136.3         105.7         (94.5 )       181.6         124.9
           Consolidated net earnings                     612.0         470.4         713.4         425.4         288.9
           Less: Net earnings attributable to noncontrolling
              interests                                    0.1          0.4          0.1           —           0.1
           Net Earnings Attributable to Martin Marietta      $   611.9     $   470.0     $   713.3     $   425.4     $   288.8
           Net Earnings Attributable to Martin Marietta Per
              Common Share (see Note A):
           Basic attributable to common shareholders      $   9.77     $   7.46     $   11.30     $   6.66     $   4.31
           Diluted attributable to common shareholders      $   9.74     $   7.43     $   11.25     $   6.63     $   4.29

           Cash Dividends Per Common Share          $     2.06     $   1.84     $   1.72     $   1.64     $    1.60

                                                                       3
                                                                                    3
           (in millions)                              2019          2018           2017           2016         2015
           Condensed Consolidated Balance Sheet Data
           Total current assets                     $   1,426.7     $   1,365.8     $   2,631.2     $   1,086.4     $   1,081.6
                         4
           Property, plant and equipment, net           5,206.0         5,157.2         3,592.8         3,423.4         3,156.0
           Goodwill                                     2,396.8         2,399.1         2,160.3         2,159.3         2,068.2
           Other intangibles, net                        486.8         501.3         506.3         511.3         510.6
           Other noncurrent assets                       615.3         128.0         101.9         120.5         141.2
                             4,5
           Total Assets                             $   10,131.6     $   9,551.4     $   8,992.5     $   7,300.9     $   6,957.6
           Current liabilities – other              $    498.5     $   396.7     $   394.3     $   366.6     $   347.9
                             5
           Current maturities of long‐term debt           340.0          390.0         299.9         180.0         18.7
                                      4
           Long‐term debt                               2,433.6         2,730.4         2,727.3         1,506.1         1,550.1
                      4
           Deferred income taxes, net                    733.0         705.6         410.7         663.0         583.5
           Other noncurrent liabilities                  773.2          379.3         477.8         442.6         397.2
                               5
           Shareholders’ equity                         5,350.8         4,946.4         4,679.7         4,140.0         4,057.3
           Noncontrolling interests                        2.5          3.0          2.8          2.6          2.9
           Total Liabilities and Equity             $   10,131.6     $   9,551.4     $   8,992.5     $   7,300.9     $   6,957.6
           1   Amounts for 2015‐2017 may not equal amounts reported in the Company’s prior years’ Forms 10‐K as amounts have been reclassified to conform to
              current year revenue presentation.
           2    Amounts for 2015‐2016 may not equal amounts reported in the Company’s prior years’ Forms 10‐K as amounts have been reclassified to reflect the
              adoption of the Accounting Standards Update 2017‐07, Improving the Presentation of Net Periodic Pension Cost and Net Periodic Postretirement Benefit
              Cost.
           3    The 2018 balance sheet reflects the acquisition of Bluegrass Materials Company (“Bluegrass”) completed on April 27, 2018.  The 2017 balance sheet reflects
              $1.1 billion of cash and long‐term debt issued in anticipation of closing the Bluegrass acquisition.
           4    Balance sheets reflect the adoption of Accounting Standards Update 2015‐03, Simplifying the Presentation of Debt Issuance Costs.
           5    The 2019 balance sheet reflects the adoption of ASC 842. The operating lease right‐of‐use assets are included in other noncurrent assets, and operating
              lease liabilities are included in other current and noncurrent liabilities.


           Celebrating 25 Years as a Public Company                                         Annual Report  ♦  Page 89