
Page 40 - Proxy Statement - 2020
P. 40
Compensation Discussion and Analysis / Our 2019 Performance
Our 2019 Performance
Building on prior year success, 2019 proved to be another year of outstanding performance. As we marked our 25 year as a public
th
company, we also achieved our eighth consecutive year of growth for revenues, adjusted gross profit, adjusted EBITDA and adjusted
earnings per diluted share (after adjusting for one-time earnings per diluted share benefit in 2017, resulting from the Tax Cuts and Jobs
Act of 2017). With continued focus on operational excellence and world-class safety, the Company delivered excellent results in 2019,
and increased shareholder value.
Net Earnings attributable to Martin Marietta of
TOTAL SHAREHOLDER RETURN of 64%, more than
$612 million and Adjusted EBITDA* of
double the S&P 500
$1.255 BILLION, an increase of 15%
Continuous commitment to SUSTAINABILITY,
Third consecutive year of WORLD-CLASS SAFETY
which is included in our strategy and compensation
performance
decisions
* See Appendix B for reconciliation to reported net earnings attributable to Martin Marietta. Adjusted EBITDA is a metric used for executive
performance targets.
Our five-year strategic planning process, or Strategic Operating Analysis and Review (SOAR), supplemented by our annual plan,
has guided us since 2010 as we have grown the business in an intentional, contemplative, and disciplined manner. Our performance
since 2010 reflects the power of our SOAR process:
2019 Highlights Disciplined Capital Allocation
✓ Record consolidated revenues of $4.7 billion, a 12% year-over- ✓ $50 million contributed to the Company’s nearly 100%
year increase, driven by double-digit aggregates and cement funded qualified pension plan
shipment growth and steady pricing gains across our Building
Materials business
✓ Achieved 8 th consecutive year of revenue, gross profit, ✓ Repurchased 416,000 shares for $98.2 million ($236.04 per
adjusted EBITDA and adjusted earnings per diluted share share); 13.7 million shares remaining on our February 2015
growth authorization
✓ Record-setting results yielded a 64 percent TSR, more than ✓ Board approved a 15% quarterly dividend increase
double the S&P 500 ($2.20/share on an annualized basis) in August, one of the
largest increases in Company history
✓ Maintained our investment grade credit rating, exiting the
year with a 2.2x leverage ratio, within our target ratio of
2.0x – 2.5x
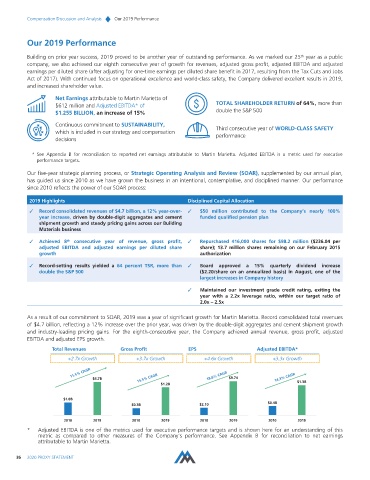
As a result of our commitment to SOAR, 2019 was a year of significant growth for Martin Marietta. Record consolidated total revenues
of $4.7 billion, reflecting a 12% increase over the prior year, was driven by the double-digit aggregates and cement shipment growth
and industry-leading pricing gains. For the eighth-consecutive year, the Company achieved annual revenue, gross profit, adjusted
EBITDA and adjusted EPS growth.
Total Revenues Gross Profit EPS Adjusted EBITDA*
+2.7x Growth +3.7x Growth +4.6x Growth +3.3x Growth
11.5% CAGR
$4.7B 15.5% CAGR 18.6% CAGR $9.74 14.3% CAGR
$1.2B $1.3B
$1.8B
$0.4B
$0.3B $2.10
2010 2019 2010 2019 2010 2019 2010 2019
* Adjusted EBITDA is one of the metrics used for executive performance targets and is shown here for an understanding of this
metric as compared to other measures of the Company’s performance. See Appendix B for reconciliation to net earnings
attributable to Martin Marietta.
36 2020 PROXY STATEMENT