
Page 42 - 2019 Annual Report
P. 42
NOTES TO FINANCIAL STATEMENTS (continued)
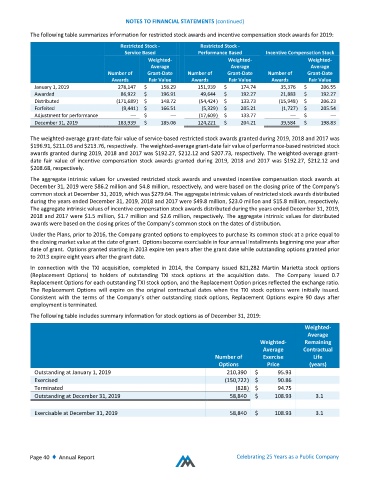
The following table summarizes information for restricted stock awards and incentive compensation stock awards for 2019:
Restricted Stock ‐ Restricted Stock ‐
Service Based Performance Based Incentive Compensation Stock
Weighted‐ Weighted‐ Weighted‐
Average Average Average
Number of Grant‐Date Number of Grant‐Date Number of Grant‐Date
Awards Fair Value Awards Fair Value Awards Fair Value
January 1, 2019 278,147 $ 158.29 151,939 $ 174.74 35,376 $ 206.55
Awarded 86,922 $ 196.91 49,644 $ 192.27 21,883 $ 192.27
Distributed (171,689 ) $ 148.72 (54,424 ) $ 133.73 (15,948 ) $ 206.23
Forfeited (9,441 ) $ 166.51 (5,329 ) $ 205.21 (1,727 ) $ 205.54
Adjustment for performance — $ — (17,609 ) $ 133.77 — $ —
December 31, 2019 183,939 $ 185.06 124,221 $ 204.21 39,584 $ 198.83
The weighted‐average grant‐date fair value of service‐based restricted stock awards granted during 2019, 2018 and 2017 was
$196.91, $211.03 and $213.76, respectively. The weighted‐average grant‐date fair value of performance‐based restricted stock
awards granted during 2019, 2018 and 2017 was $192.27, $212.12 and $207.73, respectively. The weighted‐average grant‐
date fair value of incentive compensation stock awards granted during 2019, 2018 and 2017 was $192.27, $212.12 and
$208.68, respectively.
The aggregate intrinsic values for unvested restricted stock awards and unvested incentive compensation stock awards at
December 31, 2019 were $86.2 million and $4.8 million, respectively, and were based on the closing price of the Company’s
common stock at December 31, 2019, which was $279.64. The aggregate intrinsic values of restricted stock awards distributed
during the years ended December 31, 2019, 2018 and 2017 were $49.8 million, $23.0 million and $15.8 million, respectively.
The aggregate intrinsic values of incentive compensation stock awards distributed during the years ended December 31, 2019,
2018 and 2017 were $1.5 million, $1.7 million and $2.6 million, respectively. The aggregate intrinsic values for distributed
awards were based on the closing prices of the Company’s common stock on the dates of distribution.
Under the Plans, prior to 2016, the Company granted options to employees to purchase its common stock at a price equal to
the closing market value at the date of grant. Options become exercisable in four annual installments beginning one year after
date of grant. Options granted starting in 2013 expire ten years after the grant date while outstanding options granted prior
to 2013 expire eight years after the grant date.
In connection with the TXI acquisition, completed in 2014, the Company issued 821,282 Martin Marietta stock options
(Replacement Options) to holders of outstanding TXI stock options at the acquisition date. The Company issued 0.7
Replacement Options for each outstanding TXI stock option, and the Replacement Option prices reflected the exchange ratio.
The Replacement Options will expire on the original contractual dates when the TXI stock options were initially issued.
Consistent with the terms of the Company’s other outstanding stock options, Replacement Options expire 90 days after
employment is terminated.
The following table includes summary information for stock options as of December 31, 2019:
Weighted‐
Average
Weighted‐ Remaining
Average Contractual
Number of Exercise Life
Options Price (years)
Outstanding at January 1, 2019 210,390 $ 95.93
Exercised (150,722 ) $ 90.86
Terminated (828 ) $ 94.75
Outstanding at December 31, 2019 58,840 $ 108.93 3.1
Exercisable at December 31, 2019 58,840 $ 108.93 3.1
Page 40 ♦ Annual Report Celebrating 25 Years as a Public Company