
Page 23 - 2019 Sustainability Report
P. 23
GREENHOUSE GAS EMISSIONS
OVERVIEW
This year we are reporting for the first time on our The small size of our cement operations
Scope 1 CO e emissions for all business lines: aggregates, compared to our overall business — both
2
cement, ready mixed concrete, asphalt and paving
services and Magnesia Specialties. Martin Marietta is, first in terms of revenue and production — is
and foremost, an aggregates-led company (crushed stone, an important and significant differentiator
sand and gravel). In fact, the vast majority of our facilities between Martin Marietta and other
are associated with our aggregates business, including companies operating in the cement
more than 300 quarries, mines and distribution yards. industry. Our cement business is located
Construction aggregates businesses are not large emitters solely in the United States, with two plants
of GHGs, with the predominant source being diesel
fuel used in trucks and other mobile equipment. We in Texas. The number of locations we have is
also operate a small, but strategic, cement business and significantly fewer than other companies in
the magnesia specialties business. Finally, we have two the cement business.
targeted downstream businesses: ready mixed concrete
and asphalt and paving services.
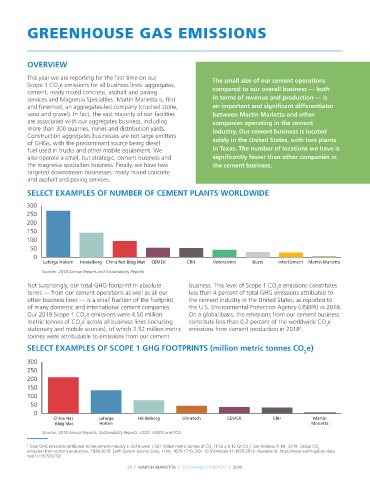
SELECT EXAMPLES OF NUMBER OF CEMENT PLANTS WORLDWIDE
300
250
200
150
100
50
300
0
250
Lafarge Holcim Heidelberg China Nat Bldg Mat CEMEX CRH Votorantim Buzzi InterCement Martin Marietta
200
Sources: 2018 Annual Reports and Sustainability Reports
150
100
Not surprisingly, our total GHG footprint in absolute business. This level of Scope 1 CO e emissions constitutes
2
50
terms — from our cement operations as well as all our less than 4 percent of total GHG emissions attributed to
other business lines — is a small fraction of the footprint the cement industry in the United States, as reported to
0
CEMEX
CRH
Votorantim
Lafarge Holcim
Heidelberg
China Nat ldg Mat
Buzzi
of many domestic and international cement companies. the U.S. Environmental Protection Agency (USEPA) in 2018.
Intercmnt
Martin Marietta
Our 2019 Scope 1 CO e emissions were 4.50 million On a global basis, the emissions from our cement business
300 2 constitute less than 0.2 percent of the worldwide CO e
metric tonnes of CO e across all business lines (including
250 2 1 2
stationary and mobile sources), of which 2.52 million metric emissions from cement production in 2018 .
200
tonnes were attributable to emissions from our cement
150
SELECT EXAMPLES OF SCOPE 1 GHG FOOTPRINTS (million metric tonnes CO e)
100 2
50
300
0
250
China Nat Lafarge Heidelberg Ultratech CEMEX CRH Martin
200 Bldg Mat Holcim Marietta
150
100
50
0
China Nat Lafarge Heidelberg Ultratech CEMEX CRH Martin
Bldg Mat Holcim Marietta
Sources: 2018 Annual Reports, Sustainability Reports, USGS, USEPA and PCA
Total GHG emissions attributed to the cement industry in 2018 were 1,507 million metric tonnes of CO (1.50 ± 0.12 Gt CO ). See Andrew, R. M., 2019. Global CO
1
2
2
2
emissions from cement production, 1928-2018. Earth System Science Data, 11(4), 1675-1710, DOI: 10.5194/essd-11-1675-2019. Available at: https://www.earth-syst-sci-data.
net/11/1675/2019/.
23 / MARTIN MARIETTA / SUSTAINABILITY REPORT / 2019