
Page 49 - 2019 Annual Report
P. 49
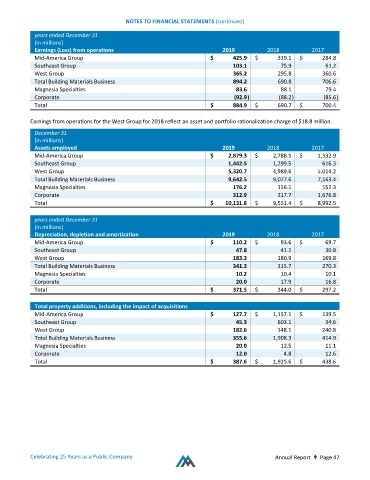
NOTES TO FINANCIAL STATEMENTS (continued)
            years ended December 31
            (in millions)
            Earnings (Loss) from operations                                2019          2018           2017
            Mid‐America Group                                           $     425.9      $   319.1      $   284.8
            Southeast Group                                                   103.1           75.9           61.2
            West Group                                                        365.2          295.8          360.6
            Total Building Materials Business                                 894.2          690.8          706.6
            Magnesia Specialties                                               83.6           88.1           79.4
            Corporate                                                          (92.9 )        (88.2 )        (85.6 )
            Total                                                       $     884.9     $    690.7     $    700.4

           Earnings from operations for the West Group for 2018 reflect an asset and portfolio rationalization charge of $18.8 million.

            December 31
            (in millions)
            Assets employed                                                2019          2018           2017
            Mid‐America Group                                           $    2,879.3      $   2,788.5      $   1,532.9
            Southeast Group                                                  1,442.5          1,299.5          616.3
            West Group                                                       5,320.7          4,989.6          5,014.2
            Total Building Materials Business                                9,642.5         9,077.6         7,163.4
            Magnesia Specialties                                              176.2          156.1          152.3
            Corporate                                                         312.9          317.7          1,676.8
            Total                                                       $   10,131.6     $   9,551.4     $   8,992.5

            years ended December 31
            (in millions)
            Depreciation, depletion and amortization                       2019          2018           2017
            Mid‐America Group                                           $     110.2      $    93.6      $    69.7
            Southeast Group                                                    47.8           41.2           30.8
            West Group                                                        183.3          180.9          169.8
            Total Building Materials Business                                 341.3          315.7          270.3
            Magnesia Specialties                                               10.2           10.4           10.1
            Corporate                                                          20.0           17.9           16.8
            Total                                                       $     371.5     $    344.0     $    297.2

             Total property additions, including the impact of acquisitions
             Mid‐America Group                                          $     127.7      $   1,157.1      $   139.5
             Southeast Group                                                   45.3          603.1           34.6
             West Group                                                       182.6          148.1          240.8
             Total Building Materials Business                                355.6         1,908.3         414.9
             Magnesia Specialties                                              20.0           12.5           11.1
             Corporate                                                         12.0            4.8           12.6
             Total                                                      $     387.6     $   1,925.6     $   438.6


           Celebrating 25 Years as a Public Company                                         Annual Report  ♦  Page 47