
Page 48 - 2019 Annual Report
P. 48
NOTES TO FINANCIAL STATEMENTS (continued)
The Chief Operating Decision Maker’s evaluation of performance and allocation of resources are based primarily on earnings
from operations. Consolidated earnings from operations include total revenues less cost of revenues; selling, general and
administrative expenses; acquisition‐related expenses, net; other operating income and expenses, net; and exclude interest
expense; other nonoperating income and expenses, net; and income tax expense (benefit). Corporate loss from operations
primarily includes depreciation on capitalized interest; expenses for corporate administrative functions; acquisition‐related
expenses, net; and other nonrecurring and/or non‐operational income and expenses excluded from the Company’s evaluation
of segment performance and resource allocation. All long‐term debt and related interest expense are held at Corporate.
Assets employed by segment include assets directly identified with those operations. Corporate assets consist primarily of cash
and cash equivalents; property, plant and equipment for corporate operations; investments and other assets not directly
identifiable with a reportable segment.
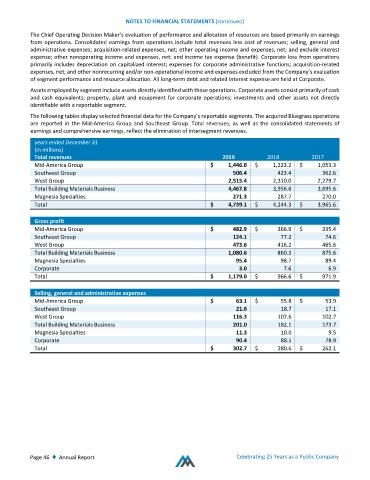
The following tables display selected financial data for the Company’s reportable segments. The acquired Bluegrass operations
are reported in the Mid‐America Group and Southeast Group. Total revenues, as well as the consolidated statements of
earnings and comprehensive earnings, reflect the elimination of intersegment revenues.
years ended December 31
(in millions)
Total revenues 2019 2018 2017
Mid‐America Group $ 1,446.0 $ 1,223.2 $ 1,053.3
Southeast Group 506.4 423.4 362.6
West Group 2,515.4 2,310.0 2,279.7
Total Building Materials Business 4,467.8 3,956.6 3,695.6
Magnesia Specialties 271.3 287.7 270.0
Total $ 4,739.1 $ 4,244.3 $ 3,965.6
Gross profit
Mid‐America Group $ 482.9 $ 366.9 $ 335.4
Southeast Group 124.1 77.2 74.6
West Group 473.6 416.2 465.6
Total Building Materials Business 1,080.6 860.3 875.6
Magnesia Specialties 95.4 98.7 89.4
Corporate 3.0 7.6 6.9
Total $ 1,179.0 $ 966.6 $ 971.9
Selling, general and administrative expenses
Mid‐America Group $ 63.1 $ 55.8 $ 53.9
Southeast Group 21.6 18.7 17.1
West Group 116.3 107.6 102.7
Total Building Materials Business 201.0 182.1 173.7
Magnesia Specialties 11.3 10.0 9.5
Corporate 90.4 88.5 78.9
Total $ 302.7 $ 280.6 $ 262.1
Page 46 ♦ Annual Report Celebrating 25 Years as a Public Company