
Page 57 - Martin Marietta - 2024 Sustainability Report
P. 57
ENVIRONMENTAL STEWARDSHIP
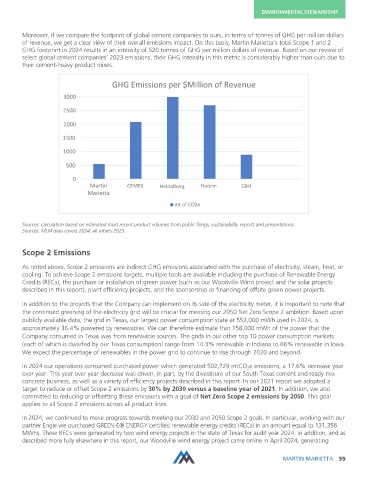
Moreover, if we compare the footprint of global cement companies to ours, in terms of tonnes of GHG per million dollars
of revenue, we get a clear view of their overall emissions impact. On this basis, Martin Marietta’s total Scope 1 and 2
GHG footprint in 2024 results in an intensity of 520 tonnes of GHG per million dollars of revenue. Based on our review of
select global cement companies’ 2023 emissions, their GHG intensity in this metric is considerably higher than ours due to
their cement-heavy product mixes.
GHG Emissions per $Million of Revenue
3000
2500
2000
1500
1000
500
0
Martin CEMEX Heidelberg Holcim CRH
Marietta
mt of CO2e
Sources: calculation based on estimated most recent product volumes from public filings, sustainability reports and presentations.
Sources: MLM data covers 2024; all others 2023.
Scope 2 Emissions
As noted above, Scope 2 emissions are indirect GHG emissions associated with the purchase of electricity, steam, heat, or
cooling. To achieve Scope 2 emissions targets, multiple tools are available including the purchase of Renewable Energy
Credits (RECs), the purchase or installation of green power (such as our Woodville Wind project and the solar projects
described in this report), plant efficiency projects, and the sponsorship or financing of offsite green power projects.
In addition to the projects that the Company can implement on its side of the electricity meter, it is important to note that
the continued greening of the electricity grid will be crucial for meeting our 2050 Net Zero Scope 2 ambition. Based upon
publicly available data, the grid in Texas, our largest power consumption state at 552,000 mWh used in 2024, is
approximately 36.4% powered by renewables. We can therefore estimate that 158,000 mWh of the power that the
Company consumed in Texas was from renewable sources. The grids in our other top 10 power consumption markets
(each of which is dwarfed by our Texas consumption) range from 14.3% renewable in Indiana to 66% renewable in Iowa.
We expect the percentage of renewables in the power grid to continue to rise through 2030 and beyond.
In 2024 our operations consumed purchased power which generated 502,729 mtCO e emissions, a 17.6% decrease year
2
over year. This year over year decrease was driven, in part, by the divestiture of our South Texas cement and ready mix
concrete business, as well as a variety of efficiency projects described in this report. In our 2021 report we adopted a
target to reduce or offset Scope 2 emissions by 30% by 2030 versus a baseline year of 2021. In addition, we also
committed to reducing or offsetting these emissions with a goal of Net Zero Scope 2 emissions by 2050. This goal
applies to all Scope 2 emissions across all product lines.
In 2024, we continued to make progress towards meeting our 2030 and 2050 Scope 2 goals. In particular, working with our
partner Engie we purchased GREEN-E® ENERGY certified renewable energy credits (RECs) in an amount equal to 131,356
MWhs. These RECs were generated by two wind energy projects in the state of Texas for audit year 2024. In addition, and as
described more fully elsewhere in this report, our Woodville wind energy project came online in April 2024, generating
MARTIN MARIETTA 55