
Page 56 - Martin Marietta - 2024 Sustainability Report
P. 56
ENVIRONMENTAL STEWARDSHIP
Not surprisingly, our total GHG footprint in absolute terms from all our other business lines is a small fraction of the
footprint of many domestic and international cement companies. Our 2024 Scope 1 CO e emissions were 2.9 million
2
metric tonnes of CO e across all business lines (including stationary and mobile sources), of which almost 1.2 million
2
metric tonnes were attributable to emissions from our cement business.
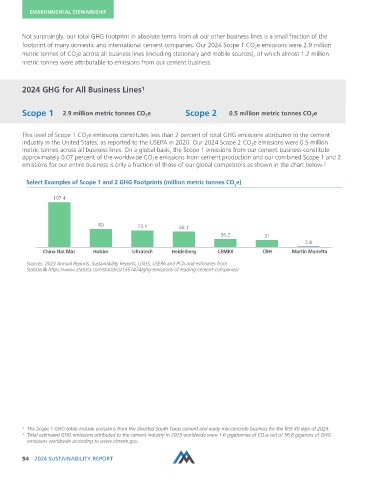
2024 GHG for All Business Lines 1
Scope 1 2.9 million metric tonnes CO e Scope 2 0.5 million metric tonnes CO e
2
2
This level of Scope 1 CO e emissions constitutes less than 2 percent of total GHG emissions attributed to the cement
2
industry in the United States, as reported to the USEPA in 2020. Our 2024 Scope 2 CO e emissions were 0.5 million
2
metric tonnes across all business lines. On a global basis, the Scope 1 emissions from our cement business constitute
approximately 0.07 percent of the worldwide CO e emissions from cement production and our combined Scope 1 and 2
2
emissions for our entire business is only a fraction of those of our global competitors as shown in the chart below. 2
Select Examples of Scope 1 and 2 GHG Footprints (million metric tonnes CO e)
2
197.4
80 73.1 68.1
36.2 31
3.4
China Nat Mat Holcim Ultratech Heidelberg CEMEX CRH Martin Marietta
Sources: 2023 Annual Reports, Sustainability Reports, USGS, USEPA and PCA and estimates from
Statista @ https://www.statista.com/statistics/1557474/ghg-emissions-of-leading-cement-companies/
1 The Scope 1 GHG totals include emissions from the divested South Texas cement and ready mix concrete business for the first 40 days of 2024.
2 Total estimated GHG emissions attributed to the cement industry in 2023 worldwide were 1.6 gigatonnes of CO 2 e out of 36.8 gigatons of GHG
emissions worldwide according to www.climate.gov.
54 2024 SUSTAINABILITY REPORT