
Page 153 - Martin Marietta - 2025 Proxy Statement
P. 153
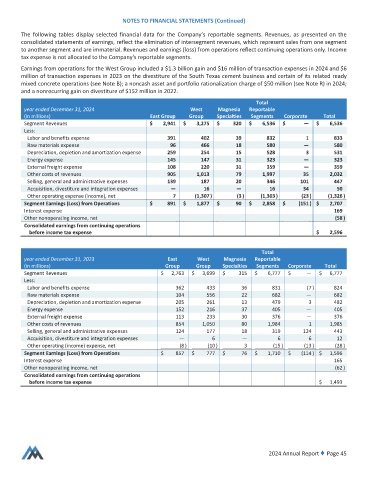
NOTES TO FINANCIAL STATEMENTS (Continued)
        The following tables displayselected financial data forthe Company’s reportablesegments. Revenues, as presentedonthe
        consolidated statements of earnings, reflect theeliminationofintersegment revenues, which represent sales fromone segment
        to anothersegment andare immaterial. Revenuesand earnings (loss) from operations reflectcontinuingoperationsonly. Income
        tax expense isnot allocatedtothe Company's reportablesegments.
        Earnings from operations forthe West Group includeda $1.3billiongainand $16 millionof transaction expenses in 2024 and$6
        millionof transaction expenses in 2023 on thedivestiture of theSouth Texascement businessand certainofits related ready
        mixedconcreteoperations(seeNote B); anoncash assetand portfolio rationalizationchargeof $50 million(seeNote R) in2024;
        anda nonrecurring gain on divestitureof $152 million in2022.
                                                                                    Total
         year ended December 31, 2024                         West     Magnesia  Reportable
         (in millions)                           East Group   Group    Specialties  Segments  Corporate  Total
         Segment Revenues                        $    2,941  $   3,275  $   320  $    6,536  $     —   $   6,536
         Less:
          Laborand benefits expense                    391        402        39        832          1        833
          Rawmaterials expense                          96        466        18        580         —         580
          Depreciation,depletion andamortizationexpense  259      254        15        528          3        531
          Energy expense                               145        147        31        323         —         323
          External freightexpense                      108        220        31        359         —         359
          Othercosts of revenues                       905       1,013       79       1,997        35      2,032
          Selling, generaland administrative expenses  139        187        20        346        101        447
          Acquisition,divestiture and integration expenses  —      16        —          16         34         50
          Otheroperating expense (income), net           7      (1,307 )      (3 )   (1,303 )     (23 )    (1,326 )
         Segment Earnings(Loss) from Operations  $     891  $    1,877  $    90  $    2,858  $   (151 ) $  2,707
         Interest expense                                                                                    169
         Othernonoperating income, net                                                                       (58 )
         Consolidated earnings from continuing operations
          before income taxexpense                                                                     $   2,596


                                                                                      Total
         year ended December 31, 2023                  East      West    Magnesia  Reportable
         (in millions)                                Group     Group    Specialties  Segments  Corporate  Total
         Segment Revenues                            $  2,763  $  3,699  $    315  $   6,777  $     —   $  6,777
         Less:
          Laborand benefits expense                       362       433        36        831        (7 )     824
          Rawmaterials expense                            104       556        22        682        —        682
          Depreciation,depletion andamortizationexpense   205       261        13        479         3       482
          Energy expense                                  152       216        37        405        —        405
          External freightexpense                         113       233        30        376        —        376
          Othercosts of revenues                          854     1,050        80      1,984         1     1,985
          Selling, generaland administrative expenses     124       177        18        319       124       443
          Acquisition,divestiture and integration expenses  —         6        —           6         6        12
          Otheroperating (income) expense, net             (8 )     (10 )       3        (15 )     (13 )     (28 )
         Segment Earnings(Loss) from Operations      $    857  $    777  $     76  $   1,710  $   (114 ) $  1,596
         Interest expense                                                                                    165
         Othernonoperating income, net                                                                       (62 )
         Consolidated earnings from continuing operations
          before income taxexpense                                                                      $  1,493


                                                                                         024 Annual Report ♦ Page 45