
Page 92 - Martin Marietta - 2024 Proxy Statement
P. 92
PAY VERSUS PERFORMANCE /
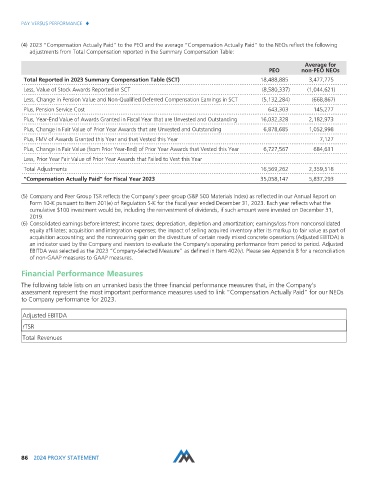
(4) 2023 “Compensation Actually Paid” to the PEO and the average “Compensation Actually Paid” to the NEOs reflect the following
adjustments from Total Compensation reported in the Summary Compensation Table:
Average for
PEO non-PEO NEOs
Total Reported in 2023 Summary Compensation Table (SCT) 18,488,885 3,477,775
Less, Value of Stock Awards Reported in SCT (8,580,337) (1,044,621)
Less, Change in Pension Value and Non-Qualified Deferred Compensation Earnings in SCT (5,132,284) (668,867)
Plus, Pension Service Cost 643,303 145,277
Plus, Year-End Value of Awards Granted in Fiscal Year that are Unvested and Outstanding 16,032,328 2,182,973
Plus, Change in Fair Value of Prior Year Awards that are Unvested and Outstanding 6,878,685 1,052,998
Plus, FMV of Awards Granted this Year and that Vested this Year 7,127
Plus, Change in Fair Value (from Prior Year-End) of Prior Year Awards that Vested this Year 6,727,567 684,631
Less, Prior Year Fair Value of Prior Year Awards that Failed to Vest this Year
Total Adjustments 16,569,262 2,359,518
“Compensation Actually Paid” for Fiscal Year 2023 35,058,147 5,837,293
(5) Company and Peer Group TSR reflects the Company’s peer group (S&P 500 Materials Index) as reflected in our Annual Report on
Form 10-K pursuant to Item 201(e) of Regulation S-K for the fiscal year ended December 31, 2023. Each year reflects what the
cumulative $100 investment would be, including the reinvestment of dividends, if such amount were invested on December 31,
2019.
(6) Consolidated earnings before interest; income taxes; depreciation, depletion and amortization; earnings/loss from nonconsolidated
equity affiliates; acquisition and integration expenses; the impact of selling acquired inventory after its markup to fair value as part of
acquisition accounting; and the nonrecurring gain on the divestiture of certain ready mixed concrete operations (Adjusted EBITDA) is
an indicator used by the Company and investors to evaluate the Company’s operating performance from period to period. Adjusted
EBITDA was selected as the 2023 “Company-Selected Measure” as defined in Item 402(v). Please see Appendix B for a reconciliation
of non-GAAP measures to GAAP measures.
Financial Performance Measures
The following table lists on an unranked basis the three financial performance measures that, in the Company’s
assessment represent the most important performance measures used to link “Compensation Actually Paid” for our NEOs
to Company performance for 2023.
Adjusted EBITDA
rTSR
Total Revenues
86 2024 PROXY STATEMENT