
Page 25 - 2019 Annual Report
P. 25
NOTES TO FINANCIAL STATEMENTS (continued)
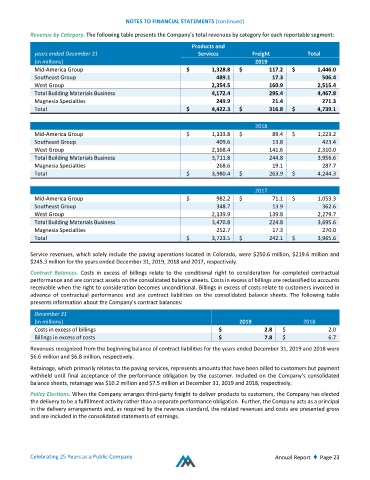
Revenue by Category. The following table presents the Company’s total revenues by category for each reportable segment:
Products and
years ended December 31 Services Freight Total
(in millions) 2019
Mid‐America Group $ 1,328.8 $ 117.2 $ 1,446.0
Southeast Group 489.1 17.3 506.4
West Group 2,354.5 160.9 2,515.4
Total Building Materials Business 4,172.4 295.4 4,467.8
Magnesia Specialties 249.9 21.4 271.3
Total $ 4,422.3 $ 316.8 $ 4,739.1
2018
Mid‐America Group $ 1,133.8 $ 89.4 $ 1,223.2
Southeast Group 409.6 13.8 423.4
West Group 2,168.4 141.6 2,310.0
Total Building Materials Business 3,711.8 244.8 3,956.6
Magnesia Specialties 268.6 19.1 287.7
Total $ 3,980.4 $ 263.9 $ 4,244.3
2017
Mid‐America Group $ 982.2 $ 71.1 $ 1,053.3
Southeast Group 348.7 13.9 362.6
West Group 2,139.9 139.8 2,279.7
Total Building Materials Business 3,470.8 224.8 3,695.6
Magnesia Specialties 252.7 17.3 270.0
Total $ 3,723.5 $ 242.1 $ 3,965.6
Service revenues, which solely include the paving operations located in Colorado, were $250.6 million, $219.6 million and
$245.3 million for the years ended December 31, 2019, 2018 and 2017, respectively.
Contract Balances. Costs in excess of billings relate to the conditional right to consideration for completed contractual
performance and are contract assets on the consolidated balance sheets. Costs in excess of billings are reclassified to accounts
receivable when the right to consideration becomes unconditional. Billings in excess of costs relate to customers invoiced in
advance of contractual performance and are contract liabilities on the consolidated balance sheets. The following table
presents information about the Company’s contract balances:
December 31
(in millions) 2019 2018
Costs in excess of billings $ 2.8 $ 2.0
Billings in excess of costs $ 7.8 $ 6.7
Revenues recognized from the beginning balance of contract liabilities for the years ended December 31, 2019 and 2018 were
$6.6 million and $6.8 million, respectively.
Retainage, which primarily relates to the paving services, represents amounts that have been billed to customers but payment
withheld until final acceptance of the performance obligation by the customer. Included on the Company’s consolidated
balance sheets, retainage was $10.2 million and $7.5 million at December 31, 2019 and 2018, respectively.
Policy Elections. When the Company arranges third‐party freight to deliver products to customers, the Company has elected
the delivery to be a fulfillment activity rather than a separate performance obligation. Further, the Company acts as a principal
in the delivery arrangements and, as required by the revenue standard, the related revenues and costs are presented gross
and are included in the consolidated statements of earnings.
Celebrating 25 Years as a Public Company Annual Report ♦ Page 23