Page 89 - Martin Marietta - 2025 Proxy Statement
        P. 89
     / PAY VERSUS PERFORMANCE
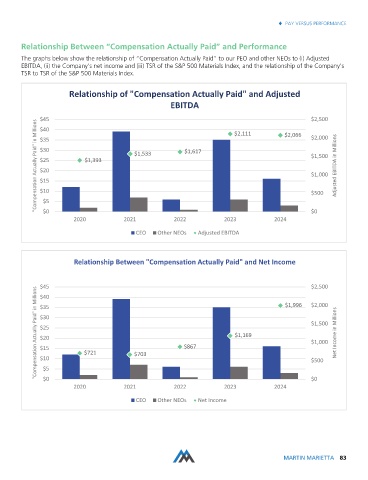
        Relationship Between “Compensation Actually Paid” and Performance
        The graphs below show the relationship of “Compensation Actually Paid” to our PEO and other NEOs to (i) Adjusted
        EBITDA, (ii) the Company’s net income and (iii) TSR of the S&P 500 Materials Index, and the relationship of the Company’s
        TSR to TSR of the S&P 500 Materials Index.
                       Relationship of "Compensation Actually Paid" and Adjusted
                                                        EBITDA               $2,111                  $2,500
              $45
             "Compensation Actually Paid" in Millions  $35  $1,393  $1,533  $1,617           $2,066  $2,000   Adjusted EBITDA in Millions
              $40
              $30
                                                                                                     $1,500
              $25
              $20
                                                                                                     $1,000
              $15
              $10
               $5
               $0
                                                                                                     $0
                         2020            2021            2022            2023             2024       $500
                                             CEO    Other NEOs   Adjusted EBITDA
                         Relationship Between "Compensation Actually Paid" and Net Income            $2,500
              $45
             "Compensation Actually Paid" in Millions  $40  $721  $703  $867  $1,169         $1,996  $2,000   Net Income in Millions
              $35
              $30
                                                                                                     $1,500
              $25
              $20
                                                                                                     $1,000
              $15
              $10
               $5
                                                                                                     $0
               $0
                         2020            2021            2022            2023             2024       $500
                                             CEO    Other NEOs   Net Income
                                                                                             MARTIN MARIETTA 83


