
Page 68 - Martin Marietta - 2025 Proxy Statement
P. 68
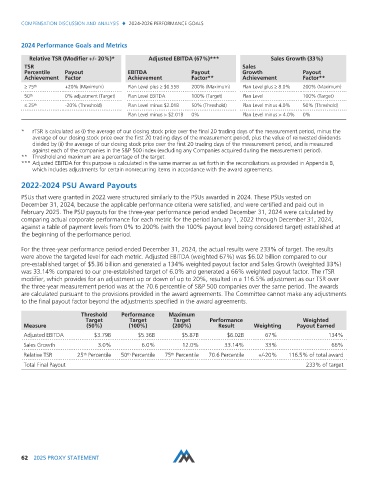
COMPENSATION DISCUSSION AND ANALYSIS / 2024-2026 PERFORMANCE GOALS


        2024 Performance Goals and Metrics
          Relative TSR (Modifier +/- 20%)*       Adjusted EBITDA (67%)***               Sales Growth (33%)
         TSR                                                                   Sales
         Percentile   Payout              EBITDA               Payout          Growth              Payout
         Achievement  Factor              Achievement          Factor**        Achievement         Factor**
         ≥ 75 th      +20% (Maximum)      Plan Level plus ≥ $0.55B  200% (Maximum)  Plan Level plus ≥ 8.0%  200% (Maximum)
         50 th        0% adjustment (Target)  Plan Level EBITDA  100% (Target)  Plan Level         100% (Target)
         ≤ 25 th      -20% (Threshold)    Plan Level minus $2.01B  50% (Threshold)  Plan Level minus 4.0%  50% (Threshold)
                                          Plan Level minus > $2.01B  0%        Plan Level minus > 4.0%  0%

        *  rTSR is calculated as (i) the average of our closing stock price over the final 20 trading days of the measurement period, minus the
           average of our closing stock price over the first 20 trading days of the measurement period, plus the value of reinvested dividends
           divided by (ii) the average of our closing stock price over the first 20 trading days of the measurement period, and is measured
           against each of the companies in the S&P 500 index (excluding any Companies acquired during the measurement period).
        ** Threshold and maximum are a percentage of the target.
        *** Adjusted EBITDA for this purpose is calculated in the same manner as set forth in the reconciliations as provided in Appendix B,
           which includes adjustments for certain nonrecurring items in accordance with the award agreements.

        2022-2024 PSU Award Payouts
        PSUs that were granted in 2022 were structured similarly to the PSUs awarded in 2024. These PSUs vested on
        December 31, 2024, because the applicable performance criteria were satisfied, and were certified and paid out in
        February 2025. The PSU payouts for the three-year performance period ended December 31, 2024 were calculated by
        comparing actual corporate performance for each metric for the period January 1, 2022 through December 31, 2024,
        against a table of payment levels from 0% to 200% (with the 100% payout level being considered target) established at
        the beginning of the performance period.

        For the three-year performance period ended December 31, 2024, the actual results were 233% of target. The results
        were above the targeted level for each metric. Adjusted EBITDA (weighted 67%) was $6.02 billion compared to our
        pre-established target of $5.36 billion and generated a 134% weighted payout factor and Sales Growth (weighted 33%)
        was 33.14% compared to our pre-established target of 6.0% and generated a 66% weighted payout factor. The rTSR
        modifier, which provides for an adjustment up or down of up to 20%, resulted in a 116.5% adjustment as our TSR over
        the three-year measurement period was at the 70.6 percentile of S&P 500 companies over the same period. The awards
        are calculated pursuant to the provisions provided in the award agreements. The Committee cannot make any adjustments
        to the final payout factor beyond the adjustments specified in the award agreements.

                           Threshold    Performance    Maximum
                             Target        Target        Target      Performance                   Weighted
         Measure             (50%)         (100%)        (200%)         Result     Weighting     Payout Earned
         Adjusted EBITDA       $3.79B         $5.36B        $5.87B        $6.02B       67%                 134%
         Sales Growth            3.0%          6.0%         12.0%        33.14%        33%                  66%
                                                        th
                                          th
         Relative TSR     25 Percentile  50 Percentile  75 Percentile  70.6 Percentile  +/-20%  116.5% of total award
                            th
         Total Final Payout                                                                         233% of target


        62 2025 PROXY STATEMENT