
Page 187 - Martin Marietta - 2025 Proxy Statement
P. 187
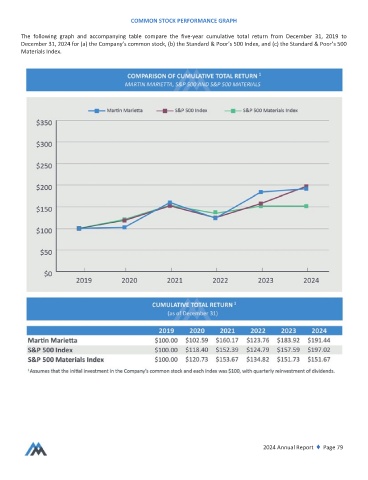
COMMON STOCK PERFORMANCE GRAPH

        The following graphand accompanying tablecompare the five-year cumulative total return from December31, 2019 to
        December31, 2024 for(a) the Company’s commonstock,(b) theStandard & Poor’s 500 Index, and(c) theStandard& Poor’s 500
        Materials Index.


                                                                                      2024 Annual Report ♦ Page 79